


Agri Review May 2018: The Sector at a Glance

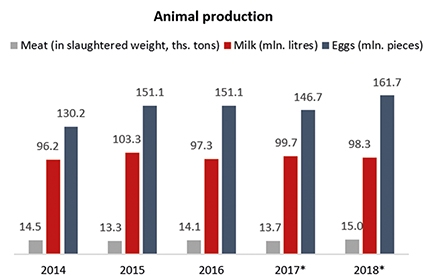
According to the data for the first quarter of 2018, the number of livestock has increased in Georgia. The biggest increase was observed for the number of sheep and goats, which increased by 35.9%. Such a sharp rise might be explained by the increased demand from East Asian countries. As to the other livestock categories, the number of bovine animals increased by 9.3%, while number of pigs and poultry increased by 7.7% and 4.1%, respectively.
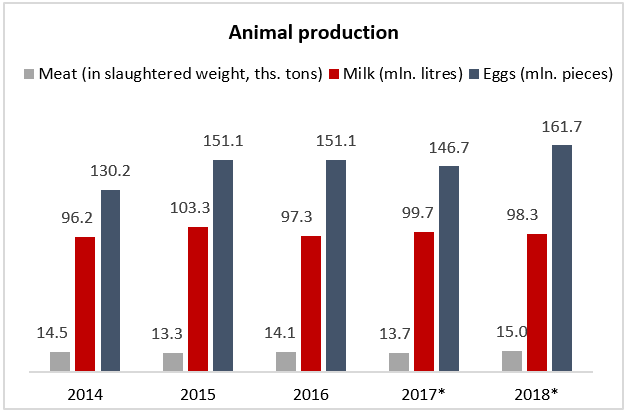
The higher number of livestock has translated into increased animal production for most animal products, except milk, which decreased by 1.4% in the first quarter of 2018, compared to the same period in 2017. As to remaining categories of animal production, the amount of meat and eggs produced increased by 9.5% and 10.2%, respectively, for the same period.
Price Highlights
In April 2018, prices for sugar, jam, honey, chocolate and confectionary decreased by 1.4%, compared to March 2018. On an annual basis, prices in this category were lower by 3.7%. According to Geostat data, the biggest price drop was mostly for sugar (-21.5%). This sharp price decrease was balanced out by a hike in prices for chocolate bars (5.2%), honey (4.3%), chewing gum (2.4%), ice-cream (0.9%), and caramel (0.2%). Given that Georgia is a net importer of these commodities, prices for sugar, jam, honey, chocolate and confectionary are driven by international prices. According to the International Sugar Organization, sugar prices decreased by 26.8%, compared to April 2017. The declining trend in the price of sugar is the result of an excess supply in the sugar market from India and Thailand, the world’s second and fourth largest sugar producing countries. In addition, Brazilian currency depreciated with respect to the US dollar, which might be putting additional pressure on sugar prices as Brazilian exports became cheaper (note that Brazil is the world’s largest producer of sugar). If international trends continue into the future, Georgian consumers may expect further price decreases, not only in sugar prices, but in sugar-sweetened beverages as well.

Trade Highlights
In April 2018, Georgia’s agricultural exports (including food) amounted to 52 mln USD, which is around 30% of total Georgian export value. While comparing this indicator to April 2017, it is 4% higher. As to imports, in April 2018, Georgia’s agro import stood at 101 mln USD, which constitutes 16% of total Georgian imports. Year over year (compared to April 2017), agricultural imports increased by 22%.
As to the Georgia’s export diversification, the first four export product groups for 2018 are the same as in previous year. Wine has the leading position in both years and is followed by ethyl alcohol and nuts. While the product groups did not change a lot, the export value increased quite significantly. The only exception is nuts (due to the well-known stink bug infestation last year). Similarly, as to exports, there is no big difference on an annual basis in the import product groups in April 2018, compared to April 2017. The top import groups were wheat and meslin, tobacco products and domestic bird meat for both years.
As to export destinations, Russia remained the biggest export market for Georgia in April. In April 2017, Georgia traded mostly with neighbors, while in April 2018, China and Kazakhstan appeared at the top of the list of trading partners. The top import countries for both April 2017 and 2018 were Russia, Ukraine and Turkey. Interestingly, in April 2018, Azerbaijan was replaced by Brazil.