


ISET GDP Forecast | Riding Out the Pandemic Storm: Trends, Projections & Uncertainties

ISET-PI has updated its real GDP growth forecast for the third and fourth quarters of 2020. Here are the highlights of this month’s release:
HIGHLIGHTS
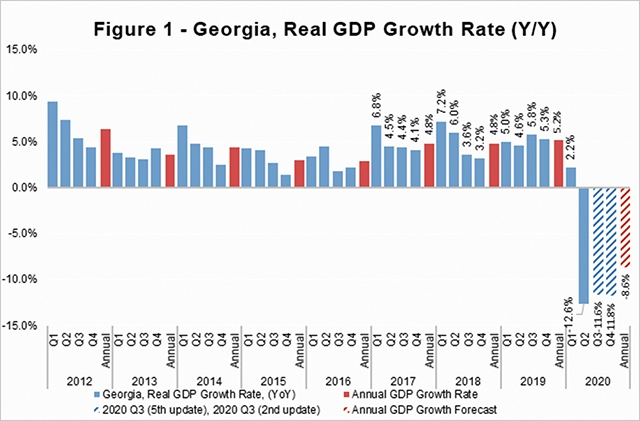
• Recently, Geostat released the preliminary estimate of real GDP growth for the second quarter of 2020, which now stands at -12.6%.
• The real GDP growth rate contracted by 7.7% and 5.5% year-on-year in June and July 2020, respectively. Consequently, the estimated real GDP for the first seven months of 2020 amounted to -5.8%.
• ISET-PI’s forecast of real GDP growth for the third quarter of 2020 stands at -11.6%. The second estimate for the fourth quarter growth forecast stands at -11.8%. Notably, our econometric model depends only on the retrospective information (past observations), thus, an abnormally large negative growth of the real GDP during the quarantine period causes overestimation of the contraction in the following quarters.
• Based on July’s data, we expect annual growth in 2020 to be -8.5%. Once again, this is most likely an overestimation of the reality, since the nature of the shock (a transitory lockdown event) in the second quarter of 2020, had not had relevant analogues in the Georgian data.
• In addition, the National Bank of Georgia revised its expectation for real GDP growth down from -4% to -5% in 2020. According to the Monetary Policy Report, among the reasons behind the prediction’s downward revision is weaker external demand than previously expected due to delays in the resumption of tourism inflows. However, domestic demand has been stronger than anticipated that was facilitated by fiscal stimulus and stronger credit activity as well as by better-than-expected remittance dynamics. The later effect is not expected to be strong enough to outweigh the effect of reduced external demand.
GDP growth by sector.
The Georgian statistics office, Geostat, has released its preliminary estimate of GDP growth for the second quarter of 2020 (based on VAT taxpayers’ turnover data). Its estimated growth figure is -12.3%. According to Geostat, administrative and support service activitie (-54.7% yearly), accommodation and food service activities (-40% yearly), Professional, scientific and technical activities (-28.8% yearly), arts, entertainment and recreation (-24.1% yearly), construction (-24.5% yearly) and transportation and storage (-22.6% yearly) were the sectors with the largest negative contribution to the annual real GDP growth in the second quarter of 2020. While the human health and social work activities (14.3% yearly), education (11.7% yearly), mining and quarrying (6.4% yearly) and agriculture, forestry and fishing (4.7% yearly) sectors were the only sectors having a positive impact to the Q2 growth figure .
External Merchandise Trade.
Weak external demand, continued social distancing and weak consumer sentiment in the partner countries due to COVID-19 pandemic had a notable negative impact on the trade statistics. In July, Georgia’s exports experienced a 21.6 % annual decline. This drop was driven by a reduction in the export/re-export of motor cars, cigarettes, and medicine to Azerbaijan, alongside the declining export of ferro-alloys and wine to Russia; export/re-export of motor cars and mineral water to Ukraine; the re-export of trucks to Armenia; and export of ferro-alloys to Iran. There was moreover significant decline in the export of goods to the European Union motivated by a drop in the export of copper ores and concentrates in Spain and Romania. While Georgian exports to Bulgaria and China (due to improved re-export of copper ores and concentrates and precious metals) experienced notable growth.
During this period, the import of goods decreased by 14.3%, driven by a reduction in petroleum and fuel product import from Azerbaijan and Turkmenistan (mostly due to reduced crude oil prices in the international market), packaged medicines and non-ferrous metal structures from Turkey, sugar and tobacco products from Ukraine, and fewer imports from China (due to reduced import of carbon steel rollers and bulldozers), Romania (due to reduced import of petroleum and fuel products), and Germany (due to reduced import of motor cars). Consequently, the trade deficit shrank by 9.4 % yearly, and amounted to 442 million USD.
Money Inflow.
As every country suffered economically in the aftermath of the health and oil price crises, there was a significant slowdown in remittance inflows from the rest of the world in March, April and May. Nevertheless, money inflow started to recover in June and July, experiencing 17.8% and 22.1% annual increase respectively. The main contributors to this rise were Azerbaijan, EU, Turkey, and Israel, whereas money inflow decreased from Russia.
International Visits and Tourism.
Tourism arrivals and receipts declineed sharply as a result of numerous travel bans, and due to precautionary behaviors. In July, the number of international visitors decreased by 95.6% yearly, while the decline in tourist numbers (visitors who spent 24 hours or more in Georgia) amounted to 93.5%. In summary, decreased inflows and the dramatically reduced number of visitors and tourists over the corresponding month have made a significant negative contribution to the growth forecast.
Foreign Direct Investment.
Nevertheless, foreign direct investment (FDI) in Georgia amounted to 237.8 million USD in the second quarter of 2020, which is 0.5% higher than the adjusted data from Q2 2020. According to Geostat, FDI experienced notable increase in such sectors as agriculture, fishing (487.7% yearly), construction (273.4% yearly), mining (130.5% yearly) and, communication (125.6% yearly), while FDI decreased in all the other sectors (the largest decline was observable in financial, and health and social work sectors). The recent trends in FDI are not taken into consideration in our model yet.
Exchange rate.
The real effective exchange rate (REER) depreciated by 0.8% monthly in July, and appreciated by 1.2% relative to the same month of the previous year. In addition, the lari exchange rate experienced a slight depreciation against the US dollar and the euro (falling by 0.5% and 4.7% respectively in monthly terms). While GEL appreciated against Turkish lira and Russian ruble by 1.3% and 4.5% respectively in monthly terms. Overall, REER-related variables had a small negative contribution to the Q3 and Q4 real GDP growth projections.
Inflation.
In July, the annual inflation rate reached 5.7%, which is 2.7 percentage points higher than the targeted 3%.The main contributors to the annual price increase were increased food (raised by 11.4% yearly) and tobacco prices (raised by 12.7% yearly), which accounted for 3 and 0.4 percentage points of annual inflation rate, respectively. However, decreased gasoline and diesel prices (24.8% and 23.5% annually respectively) made a negative contribution (-1.1 ppts) to the annual inflation measure. The latter trend is mostly a reflection of significantly weakened oil prices on the global market (Europe Brent Spot Price (COP) decreased by 32.4% yearly). While, the measure of core inflation amounted to 5.8%.
Monetary Policy.
In addition, the National Bank of Georgia (NBG) reduced the Monetary Policy Rate (MPR) by 0.25 percentage point to 8% in August to stimulate borrowing and contribute to higher growth. While, in September, monetary policy committee of NBG decided to keep MPR unchanged due to significant depreciation of the national currency and risks of emerging inflationary expectations.
Our forecasting model is based on the Leading Economic Indicator (LEI) methodology developed by the New Economic School, Moscow, Russia. We have constructed a dynamic model of the Georgian economy, which assumes that all economic variables, including GDP itself, are driven by a small number of factors that can be extracted from the data well before the GDP growth estimates are published. For each quarter, ISET-PI produces five consecutive monthly forecasts (or “vintages”), which increase in precision as time passes. Our first forecast (the 1st vintage) is available around five months before the end of the quarter in question. The last forecast (the 5th vintage) is published in the first month of the next quarter.
By Davit Keshelava and Yasya Babych