


ISET GDP Forecast | Georgia’s Growth Rate Remains Negative; Swift Recovery Expected Next Year

ISET-PI has updated its real GDP growth forecast for the third and fourth quarters of 2020. Here are the highlights of this month’s release:
HIGHLIGHTS
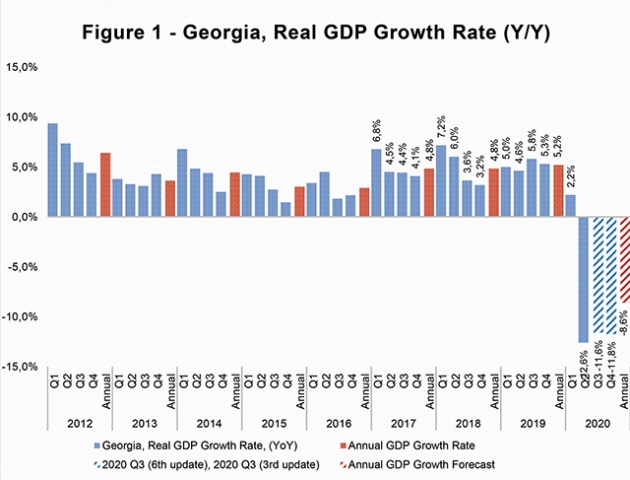
• ISET-PI’s forecast of real GDP growth for the third quarter (July-September) of 2020 remains at -11.6%, unchanged from last month’s prediction. The third estimate for the fourth quarter (October-December) growth forecast stands at -11.8%. Notably, our econometric model depends only on retrospective information (past observations), thus, the abnormally large negative growth of real GDP during the state of emergency period causes an overestimation of the contraction in the following quarters.
• Geostat recently published its preliminary estimate of real GDP growth for August, which currently stands at -5.3%. As a result, the real GDP growth estimate for the first eight months of 2020 is -5.6%.
• Based on August’s data, we expect annual growth in 2020 to be -8.6%. Once again, this is most likely an overestimation of the severity, since the nature of the shock (a transitory lockdown event) in the second quarter of 2020 does not have relevant analogues in the Georgian data.
Georgia’s GDP Growth – what do the forecasts say?
Most international organizations lowered their forecasts of Georgia’s real GDP growth for 2020, while expecting a quick recovery in 2021. According to the Asian Development Bank’s (ADB) recent Economic Outlook, Georgia’s economy is expected to decline by 5% this year (mostly due to COVID-19), picking up to 4.5% in 2021. Notably, Georgia’s real GDP growth forecast is one of the lowest among ADB countries (for detailed information see Figure 2). Both the International Monetary Fund (IMF) and the National Bank of Georgia (NBG) have similar real GDP predictions as ADB.
The World Bank (WB) has the most conservative prediction among international (and even national) organizations. According to the WB, the economy is projected to contract by 6% in 2020, with severe welfare consequences and predicted poverty increases of up to 2.8 percentage points . This translates into 160,000 Georgians becoming impoverished and 400,000 suffering downward mobility. The most optimistic predictions so far have been provided by the Ministry of Finance of Georgia (MoF)–Georgia’s economy is predicted to decline by 4.9% in 2020, picking up to 5% growth in 2021.
External Trade
Weak external demand, continued social distancing (together with the introduction of certain government restrictions) and weak consumer sentiment in partner countries had a notable negative impact on trade statistics. In August, Georgia’s exports experienced a 7.5% annual decline. This drop was driven by reduced re-export of motor cars and trucks to Armenia, export/re-export of motor cars, cigarettes, and tobacco products to Azerbaijan, alongside the declining export of chemical and mineral fertilizers and mechanical equipment to Turkmenistan; export/re-export of motor cars and medicines to the Kyrgyz Republic; and export of ferroalloys and sheep/goats to Iran. There was, moreover, a significant decline in the export of goods to the European Union motivated by a drop in the export of copper ores and concentrates to Romania. At the same time, Georgian exports to Bulgaria and China (due to improved re-export of “copper ores and concentrates” and “precious metals”), and Turkey (due to increased export of ferroalloys and textiles) experienced notable growth.
During this period, the import of goods decreased by 19.3%, driven by a reduction in petroleum and fuel product imports from Turkmenistan (mostly due to reduced crude oil prices on the international market), packaged medicines, and non-ferrous metal structures from Turkey, packaged medicines and tobacco products from Ukraine, and fewer imports from Japan, Romania, Germany, and Iran. Consequently, the trade deficit shrank dramatically by 27.1% yearly, and amounted to 350.8 million USD.
Money Inflow, International Visits, and Tourism
After a significant slowdown in remittance inflows due to the ongoing health and oil price crises, money inflows recovered in June, July, and August. In August, remittances increased by 25.8% annually and reached 184.2 million USD. The main contributors to this increase were Azerbaijan (by 269.6% YoY, contributing 3.5 ppts), EU countries (by 33.3% YoY) including Italy (by 35.9% YoY, contributing 5 ppts), Greece (by 40.1% YoY, 4 ppts) and Germany (by 62.4% YoY, 1.8 ppts), along with Turkey (by 21.7% YoY, 1.2 ppts), Ukraine (by 187.1% YoY, 4.9 ppts), and the USA (by 45.8%, 4.7 ppts). Whereas money inflows decreased from Russia (by 1.5% YoY, -0.4 ppts) and the Kyrgyz Republic (by 68.3% YoY, -1.1 ppts). Remittances have made a significant positive contribution to the growth forecast.
Tourism arrivals and receipts declined sharply as a result of numerous travel bans, as well as due to precautionary behaviors on the part of potential tourists. In August, the number of international visitors decreased by 96% yearly (driven by Armenia [-16.9 ppts], Azerbaijan [-20.5 ppts], Russia [-18.7 ppts] and Turkey [-12.7 ppts]), while the decline in tourist numbers (visitors who spent 24 hours or more in Georgia) amounted to 79.2%. In summary, decreased tourism spending along with dramatically declining numbers of visitors and tourists over the corresponding months have made a significant negative contribution to the growth forecast.
Inflation and Monetary Policy
According to our model, another negative contributor to growth was the increased consumer price index, compared to the same month of the previous year. In August, the annual inflation of consumer prices amounted to 4.8%, which is notably higher than the targeted 3%. Approximately 2.4 percentage points of CPI inflation were related to higher food prices (9.1% annual increase), while tobacco prices contributed 0.4 percentage points (13.4% annual growth). However, decreased oil prices (22.5% annually) made a notable negative contribution (0.8 ppts) to the annual inflation measure. The latter trend is mostly a reflection of significantly weakened oil prices on the global market (Europe Brent Spot Price (COP) decreased by 24.2% yearly). It is worth noting that the annual inflation trend is now reverting and approaching the inflation target from above (see Figure 3).
In addition, the National Bank of Georgia has reduced the Monetary Policy Rate (MPR) three times over the past several months: in April by 0.5 ppt and in June and August by 0.25 ppt each, decreasing the MPR to 8%. This move has been calculated as a monetary policy measure to stimulate economic recovery. In September, however, the monetary policy committee of NBG decided to keep MPR unchanged due to significant depreciation of the national currency and risks of emerging inflationary expectations.
National and Foreign Currency Deposits
The other group of variables that experienced notable monthly and yearly changes in August and made a small positive contribution to the Q3 and Q4 forecasts, was the volume of National Currency Deposits in commercial banks. The largest yearly increase was observed in National Currency Time Deposits with Maturity Less than 3 Months–a 142.6% increase relative to the same month of the previous year. The second largest yearly increase was experienced within National Currency Time Deposits with Maturity More than 12 Months–a 110.6% increase year-over-year. Indeed, we can see from the forecast that an increase in National Currency Deposits-related variables had a positive contribution to the GDP growth projection.
The growth was relatively moderate in the case of Foreign Currency Deposits in commercial banks. As a result, deposit dollarization reduced by 1.3 ppts to 60.7%. (In the meantime, the Dollarization Ratio of the total credit portfolio amounted to 56.2%).
Our forecasting model is based on the Leading Economic Indicator (LEI) methodology developed by the New Economic School, Moscow, Russia. We have constructed a dynamic model of the Georgian economy, which assumes that all economic variables, including GDP itself, are driven by a small number of factors that can be extracted from the data well before the GDP growth estimates are published. For each quarter, ISET-PI produces five consecutive monthly forecasts (or “vintages”), which increase in precision as time passes. Our first forecast (the 1st vintage) is available around five months before the end of the quarter in question. The last forecast (the 5th vintage) is published in the first month of the next quarter.
By Davit Keshelava and Yasya Babyc